How League of Legends Draft Analytics Predict Worlds Match Outcomes
Did you know that over 65% of professional League of Legends matches are statistically decided before minions spawn? Here is how draft phase analytics, blue-side priority, and live API telemetry model competitive match outcomes.

Mathematical Dominance: Decoding Draft Phase Analytics in Professional League of Legends
In elite competitive esports, games are rarely won through accidental individual heroics. At the League of Legends World Championship, victory is often determined during the six-minute draft phase that precedes the match.
With modern coaching staffs employing dedicated data science teams, competitive drafts are no longer governed by player comfort alone. Predictive neural networks analyze champion synergy indices, enemy player champion pools, and gold scaling curves to calculate match win probability before players enter Summoner's Rift.
Below is an exploration of how advanced data modeling evaluates professional LoL drafts, why side selection dictates tactical flexibility, and how live telemetry informs competitive sportsbooks.
Blue Side vs. Red Side: The Asymmetry of Drafting
Map geometry and draft order create an intrinsic competitive divide in professional play:
Worlds Championship Side Selection Bias:
[============================= ] Blue Side Win Rate: 58.4% (First Pick Priority)
[==================== ] Red Side Win Rate: 41.6% (Last Counter-Pick Priority)
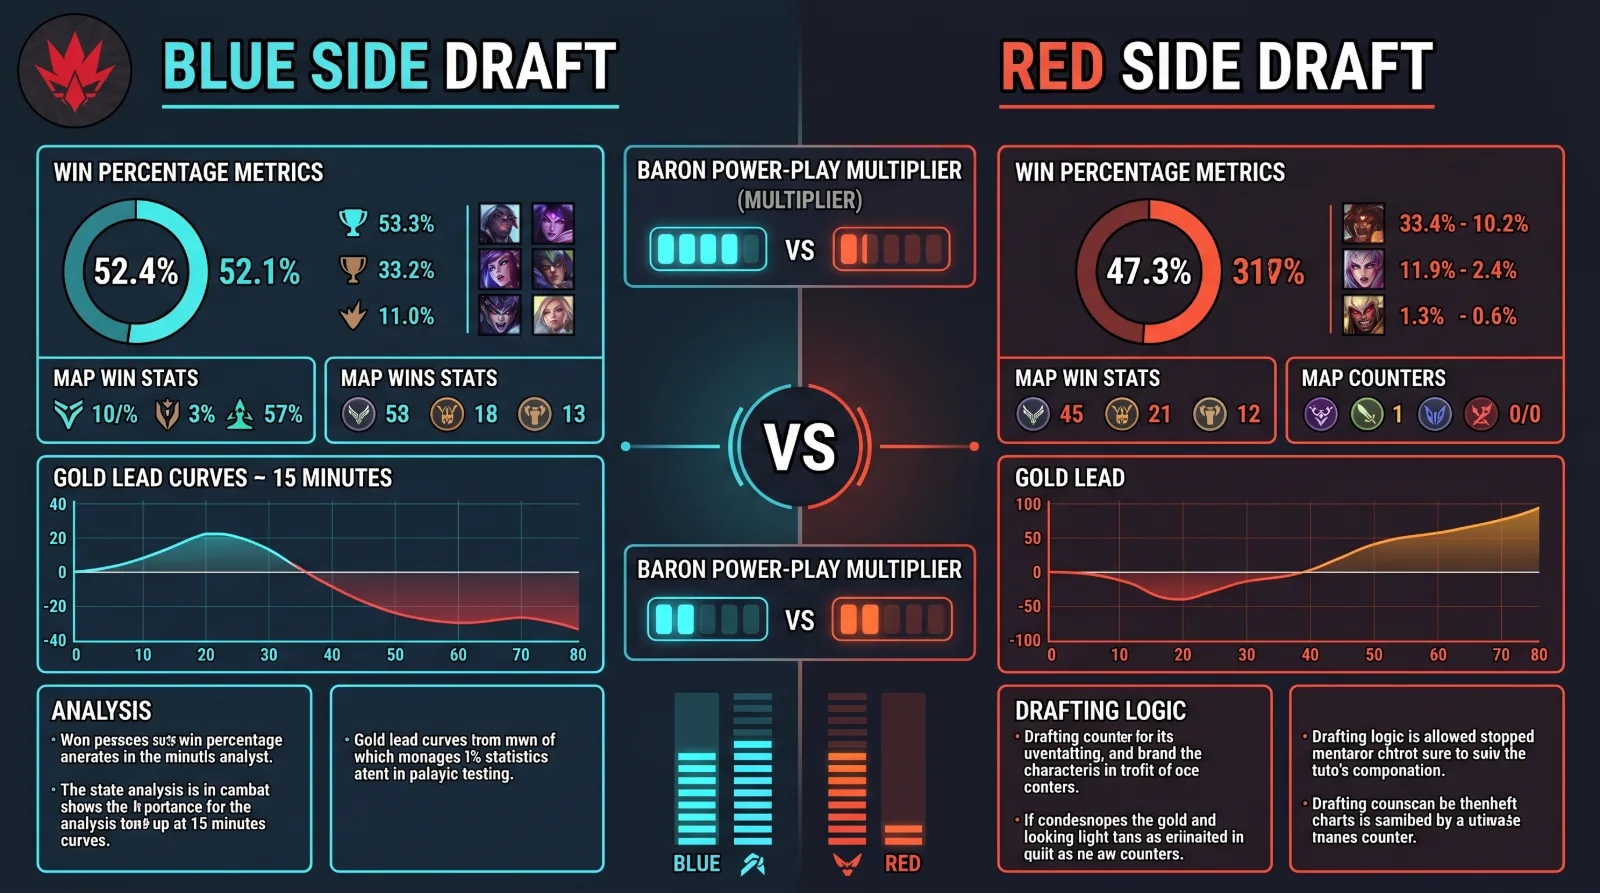
- Blue Side Priority (First Pick): Blue side locks the single strongest power-pick in the current tournament meta (such as a multi-flex mid/top bruiser). This forces the red side team to burn 2 to 3 mandatory "must-ban" slots just to mitigate draft openings.
- Red Side Value (The True Counter): Red side receives the final pick (R5). This is traditionally reserved for top lane or mid lane specialists, allowing an elite team to secure a completely un-counterable lane matchup that neutralizes the enemy game plan.
Gold Differential at 15 Minutes (GD@15) as a Predictive Anchor
Analytical models rely heavily on the GD@15 (Gold Difference at 15 Minutes) metric:
- The Critical Breakpoint: Teams that establish a gold lead greater than +2,500 gold at 15 minutes win approximately 81.2% of professional matches.
- Dragon Stacking Curves: Securing the first two elemental dragons creates an objective timer. The opposing squad is forced into contest positions around the third and fourth dragon spawns, allowing early-game drafting teams to dictate choke-point vision control.
Live Telemetry & Modern Esports Analytics
Today's leading esports data providers and analytical platforms ingest official tournament server API feeds with sub-second latency, feeding parameters into real-time probability algorithms:
- Scaling vs. Pacing Index: Balancing early lane priority against late-game team-fight damage scaling.
- Baron Power-Play Efficiency: Calculating the average structural gold extracted per team per 3-minute neutral objective buff.
- Live Probability Modeling: Adjusting match projection curves continuously as vision control and turret plates fall.